- Home
- Genomes
- Genome Browser
- Tools
- Mirrors
- Downloads
- My Data
- Projects
- Help
- About Us
HOW DO CELLS DIFFERENTIATE?
A few decades ago, researchers questioned how somatic cells of the human body, despite having the same genome, were able to differentiate into such specific types, both in their morphology and function. Today, it is known that different cell types express different genes, which gives them unique characteristics allowing them to carry out their function. For this to occur, the DNA undergoes a series of chemical modifications (that do not alter the nucleotide sequence), which regulate gene activity: methyl groups (-CH3) are attached to carbon 5 of the cytosines forming the 5-methylcytosine (Figure 1). This modification causes inhibition of gene expression because transcription factors (TFs) can then not bind to the DNA. These chemical modifications are known as DNA methylations. Methylation is carried out by a group of enzymes called DNA methyltransferases (DNMTs). In general, DNMTs act in regions rich in CpG dinucleotides; these regions are known as CpG islands and are found in the regulatory regions of genes.

Figure 1. Cytosine molecule (left) and 5-methylcytosine (right). The methyl group is indicated by the arrow. The molecules were drawn with the JSME software (Bienfait, B. & Ertl, P., 2013).
For illustrative purposes, the BRCA1 gene was taken as a proxy. This gene is involved in the regulation of the cell cycle, reducing excessive proliferation. When the BRCA1 gene is hypermethylated, it is not expressed, so the risk of contracting diseases such as breast cancer increases.
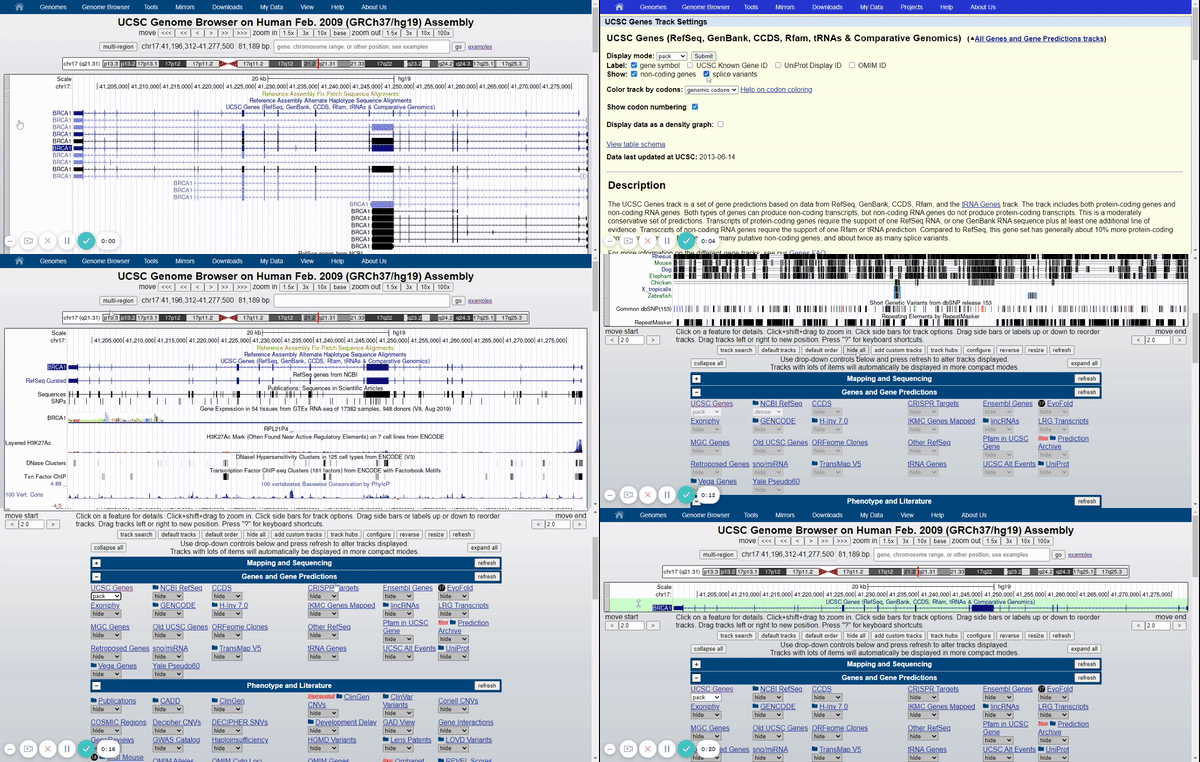
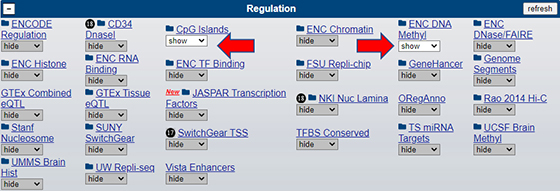
To visualize the BRCA1 gene in the Genome Browser, the human genome assembly (2009) was selected (UCSC Genome Browser on Human Feb. 2009 (GRCh37 / hg19) Assembly) and BRCA1 was typed into the search bar (Figure 2). Afterwards, the different variants of the gene and the tracks were hidden, leaving only the UCSC Genes track with the pack option (Figure 3) (for more information about the UCSC Genome Browser configuration, please visit: UCSC Genome Browser Basics. Part 1: Getting around in the Browser). Finally, in the regulation drop-down control, the CpG islands track and ENC DNA Methyl track were activated (Figure 4).

Figure 2. Search for the term BRCA1 in the UCSC Genome Browser on Human Feb. 2009 (GRCh37/hg19).

Figure 3. Elimination of gene variants and tracks by default except for the UCSC Genes track (pack).

Figure 4. Regulation group drop-down controls. The red arrows indicate that the CpG islands and ENC DNA Methyl tracks are enabled.
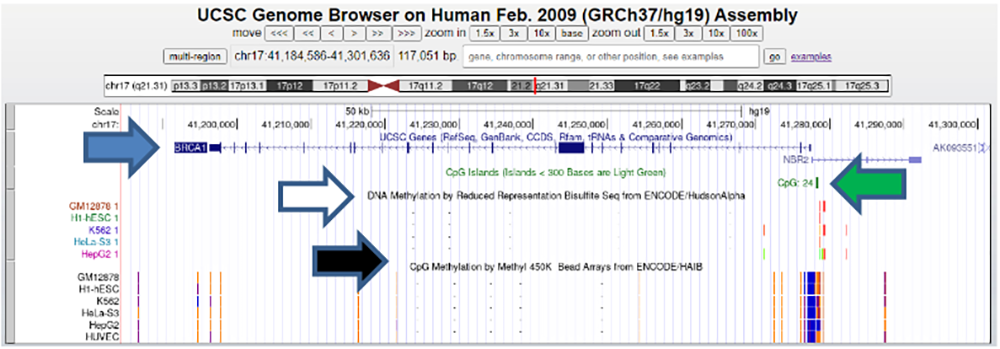
The results are shown in Figure 5 (an enlargement of the figure with a focus on the CpG islands and the methylation patterns is shown in Figure 6). It shows the BRCA1 gene with its introns and exons (solid lines and blue boxes, respectively). It is also observed that a CpG island is found between the coordinates 41,270,000 and 41,280,000. In addition, methylation patterns of various cancer cell lines (with the exception of H1-hESC and HUVEC) are shown using the bisulfite method and with Illumina Methyl 450k, which has high resolution.
The bisulfite method consists of treating DNA samples with bisulfite. This reagent deaminates unmethylated cytosines, converting them into uracil molecules. Therefore, with a sequencing prior treatment and later PCR amplification, it is possible to identify those cytosines that are methylated from those that are not (unmethylated cytosines will appear as thymine and those that are methylated will maintain the cytosine molecule).

Figure 5.Visualization of the BRCA1 Gene (blue arrow), CpG islands (green arrow) and DNA methylations in different cell lines using the bisulfite Seq (white arrow) and Methyl 450k method (black arrow) in the UCSC Genome Browser.
 https://genome.ucsc.edu/s/education/hg19_methylationAndIslands

Figure 6. Zoomed-in view of figure 5 with focus on the CpG island and methylation patterns.
 https://genome.ucsc.edu/s/education/hg19_methylation
CpG islands are generally found in regulatory regions such as promoters. However, in this case, the CpG island and the regulatory region do not match. This can be demonstrated using the ENCODE Transcription Factor Binding (ENC TF Binding) track (Figure 7) that shows the regions that are recognized by transcription factors to initiate transcription. Because different factors bind the region in different tissues, the gene will have different expression patterns in different tissues.

Figure 7. Illustration of the binding regions of the transcription factors (red bracket on left) and the CpG island (right bracket).
 https://genome.ucsc.edu/s/education/hg19_tfbs
The UCSC Genome Browser allows us to obtain the sequence of the DNA we are working with (Figures 8 and 9). In Figure 8, we zoom to the regions defined by the red brackets in Figure 7 and get the DNA. Using the Extended Case/Color options in the Browser, we are able to see the exact locations of the two types of methylations and other annotations of interest.

Figure 8. Procedure to obtain the DNA sequence of interest. We zoom to the desired region, select "View > DNA" from the top bluebar menu and use the "extended case/color options" to decorate the DNA: Uppercase for CpG Islands (blue) and the two Methylation tracks (red and green) and bold for Transcription Factors (TFBS),

Figure 9. DNA sequence with the promoter region (region with bold lower-case letters), CpG island (blue letters) and the methylations with the bisulfite method and 450k of illumina (green and red letters, respectively. Matches of the two methods appear in orange).
Chemical modifications of the genome that do not alter the nucleotide sequence itself; the study of their interactions with proteins that alter gene expression is known as epigenomics. In addition to DNA methylations, the field of epigenomics also studies chemical modifications in histones, proteins that participate in DNA packaging; DNA is wrapped around them to form compact structures called nucleosomes. When histones are methylated, the expression of the genes found in that region is repressed. On the other hand, when histone acetylation occurs (acetyl groups bound to lysine amino acids), chromatin is relaxed, allowing transcription factors (TFs) access to bind to DNA. Histone methylation and acetylation are closely related to chromatin conformation. Histone modifications can be viewed in the UCSC Genome Browser with the ENCODE Histone Modification (ENC Histone) track.
In this module, it was possible to observe the CpG islands and the methylation patterns of the BRCA1 gene in various cell types. The UCSC Genome Browser allows you to dynamically view this data and many other gene annotations.
ASSIGNMENT
- Use the human genome assembly 2009 (UCSC Genome Browser on Human Feb. 2009 (GRCh37 / hg19) Assembly) and look at the HOXA1 gene (transcript variant 1, mRNA). This gene is involved in embryonic development.
- Identify the CpG islands by activating the CpG islands track. Note that the CpG islands with less than 300 bases are shown in light green.
- Use the ENC DNA Methyl track to identify DNA methylation patterns.
- Finally, enable the ENC TF Binding. Note that the CpG islands and TF Binding sites match.
Tip: All the tracks� drop-down controls are in the regulation section below the Browser graphic.
FURTHER READING
Yoshida, K., & Miki, Y. (2004). Role of BRCA1 and BRCA2 as regulators of DNA repair, transcription, and cell cycle in response to DNA damage. Cancer science, 95(11), 866-871.
Wang, K. C., & Chang, H. Y. (2018). Epigenomics: Technologies and Applications. Circulation research, 122(9), 1191-1199.
Bienfait, B., Ertl, P. (2013). JSME: a free molecule editor in JavaScript. J Cheminform 5, 24.
Epigenomics Fact Sheet at genome.gov
Written by Arturo Marquez, University of Sonora, Mexico