- Home
- Genomes
- Genome Browser
- Tools
- Mirrors
- Downloads
- My Data
- Projects
- Help
- About Us
CRISPR TARGETS and CRISPR/Cas9 ON THE GENOME BROWSER
As genome editing becomes more efficient and prevalent in medicine and in treating diseases, it is useful to look at CRISPR/Cas9. The Genome Browser has resources to enable research using CRIPSR. The CRISPR/Cas9 system functions as a find-and-replace feature — similar to the edit feature found on google docs or word docs. You select a sequence in the human genome that you want to edit using CRISPR, then utilize a guide RNA to recognize the desired sequence. From here, the guide RNA is attached to Cas9, an enzyme that then locates the target zone using the guide, and cuts, replaces, or adds sequence. In today's example, we will be looking out how we can use the Genome Browser to find specific guide RNA sequences for the gene ARID1A, a cancer-associated gene, through the data track, "CRISPR Targets."
In Figure 1, we can see the main Browser display of the ARID1A gene on the hg38 assembly.

Figure 1. ARID1A gene in the hg38 Genome Browser session view.
 https://genome.ucsc.edu/s/education/arid1a_home
The "CRISPR Targets" data track shows the DNA sequences targetable by CRISPR RNA guides using the Cas9 enzyme. Turning on the data track, we see a series of black lines seen at the bottom of Figure 2, indicating locations with suitable guide RNAs using the Cas9 enzyme. Highlighted in yellow is one of the exons within the ARID1A gene, which we will be taking a closer look at in order to fully understand the capabilities of the "CRISPR Targets" data track.

Figure 2. "CRISPR Targets" data track shown at bottom of Figure. Highlighted in yellow is the exon of focus to illustrate the capabilities of the "CRISPR Targets" data track.
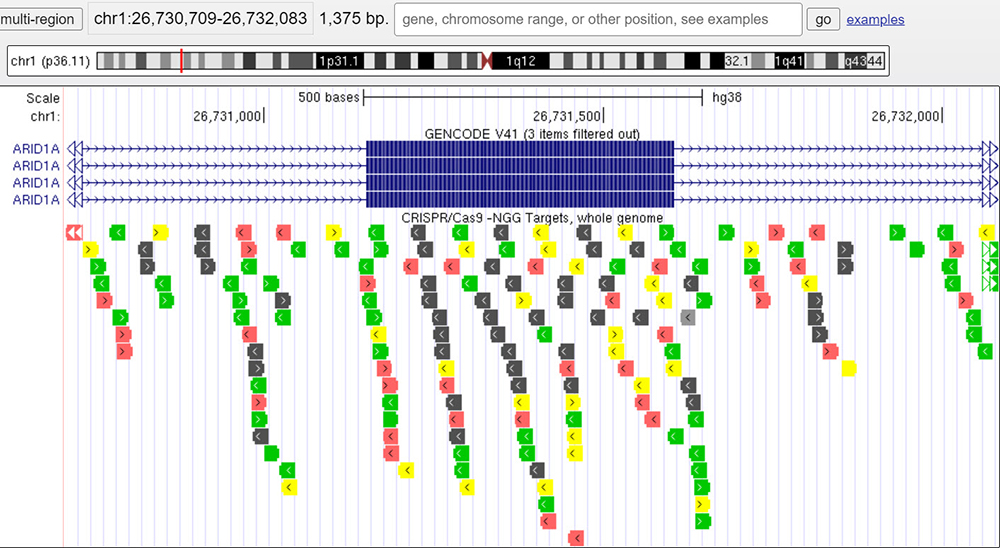
Zooming in on the yellow highlighted exon, we are brought to the view shown in Figure 3. Here, we can see all the possible guide RNA locations for the DNA sequence within the Browser window. Each guide-RNA is color-coded based on the overall cleavage efficiency of the target sequence. On the "CRISPR Targets" data track main page, we learn that different shades of gray denote "Sites that are hard to target specifically, as the 20mer is not very unique in the genome." As for the colored targets: "Colors highlight targets that are specific in the genome (MIT specificity > 50) but have different predicted efficiencies" where red signifies "low predicted cleavage: Doench/Fusi 2016 Efficiency percentile <= 30", yellow: "medium predicted cleavage: Doench/Fusi 2016 Efficiency percentile > 30 and < 55," and green: "high predicted cleavage: Doench/Fusi 2016 Efficiency > 55.".
On the track's details page, there is specific information about the efficiency score, MIT specificity score, and Moreno-Mateos 2015 Score to help tell us about the colored guide-RNA:
- The MIT Specificity score summarizes all off-targets into a single number from 0-100. The higher the number, the fewer off-target effects are expected. We recommend guides with an MIT specificity > 50.
- The efficiency score tries to predict if a guide leads to rather strong or weak cleavage. According to Haeussler et al. (2016), the Doench 2016 Efficiency score should be used to select the guide with the highest cleavage efficiency when expressing guides from RNA PolIII Promoters such as U6. Scores are given as percentiles, e.g. "70%" means that 70% of mammalian guides have a score equal or lower than this guide. The raw score number is also shown in parentheses after the percentile.
- The Moreno-Mateos 2015 Efficiency score should be used instead of the Doench 2016 score when transcribing the guide in vitro with a T7 promoter, e.g. for injections in mouse, zebrafish or Xenopus embryos. The Moreno-Mateos score is given in percentiles and the raw value in parentheses, see the note above.

Figure 3. Zoomed-in section of the yellow highlighted area from Figure 2. Colored guide-RNA target sites can be seen spanning the entire session window and denote the cleavage efficiency at those locations.
 https://genome.ucsc.edu/s/education/crispr_fig3
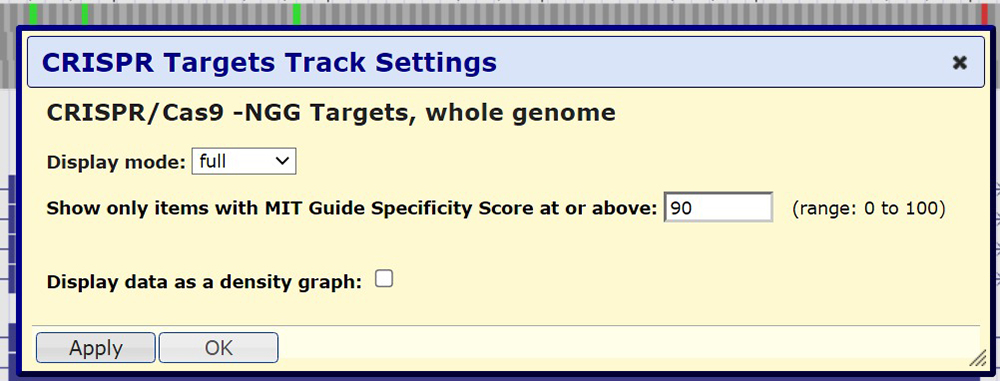
One useful feature of the "CRISPR Targets" data track is the ability to filter by specificity/efficiency scores. By clicking on the left gray sidebar, we are brought to the track's configuration menu as seen in Figure 4. Here, we can choose our preferred specificity score. In this illustration, a score of 90 will be chosen. Clicking on submit will bring us to the view seen in Figure 5.

Figure 4. "CRISPR Target" track settings. Here we can adjust the display mode and specificity score, and select if we want to display the data as a density graph.

Figure 5. Specificity score of 90 or higher on the "CRISPR Targets" data track.
Notice how there is a significant difference in the number of guide RNA sequence targets. Hovering the mouse over a specific target will display a small window with the different specificity/efficiency scores.
 https://genome.ucsc.edu/s/education/crispr_fig5
Notice in Figure 5 in comparison to Figure 3 the significant difference in guide RNA sequence targets. This is a direct result of the filter we applied. Also notice how although the score is 90 or higher, there are still red or yellow target sites. We can clearly see here that although the specificity is high for these targets, the efficiency rate can still be low.
REFERENCES
Haeussler M, et. al. Evaluation of off-target and on-target scoring algorithms and integration into the guide RNA selection tool CRISPOR